
YouTube Analytics: How To Analyze Data & Upgrade Your Channel
When you start developing a strong YouTube channel, the first thing you need to do is to know your audience.
YouTube analytics is an excellent way to find out what people are interested in, and it can help you decide which videos best cater to your audience.
It measures all the stats of the entire channel. Do you want to know the answer to where your viewers come from? A video audit of your YouTube channel can show you that!
Make sure you are constantly trying to improve your channel and work on attracting new viewers. The best way to do that is by making high-quality videos that will keep people engaged not just presently, but also in the future!
YouTube Analytics is a great tool for YouTube creators who want to know how their own channel is performing from an analytical perspective.
It can also be very daunting if you’re just starting because there can be so much data to work through! This article will guide you on how you can navigate YouTube Analytics and make the best of it for your channel.
Why Is Measuring YouTube Analytics Important?
Your analytics help you understand where your channel stands, how to improve it, and what steps need to be taken next. YouTube has an unpredictable algorithm and it’s intense to compete on the platform. The more you optimize your YouTube channel, the better it will be. Here are important tips that are worth noting under YouTube Analytics:
# Audience engagement, number of views, and watch time influence videos to perform highly.
#Create content that is relevant to your YouTube audience. The best way to do this would be by creating how-to guides, tutorials, and other types of video material for them.
#Video details like titles, thumbnails, and length of the videos are important in determining your video performance.
Recently, YouTube analytics has been a goldmine for many businesses as it provides detailed information about the success of their marketing strategy.
YouTube Channel Analytics- Learn How To Use It
YouTube analytics is an essential tool for understanding how your videos are being received. Data such as viewing rates and engagement metrics can help you create a video strategy that will encourage long-term growth on YouTube, which in turn increases revenue opportunities with advertising or sponsorship deals.
Desktop
- Access your account by signing into your YouTube account, on your desktop.
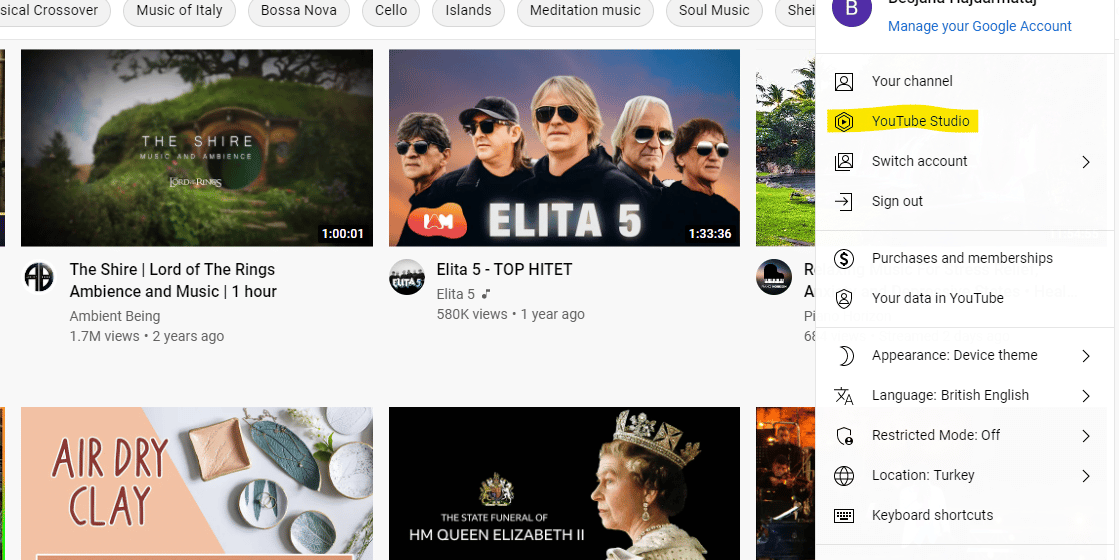
- Select YouTube Studio under the upper right-hand corner of your profile icon.
- Now that you’ve signed in and accessed your YouTube channel, click on the Analytics tab from the left menu or go straight to CHANNEL ANALYTICS under video thumbnails of Top uploads.

- The Analytics page is the perfect place to find all of your analytics information. You can switch between tabs such as Content, Audience, and Research to get a better understanding of what’s going on with each section on YouTube.
- Clicking on the Advanced Mode button will take you to a page that contains more detailed information about your video analytics and overall channel performance.
- The advanced mode of this report allows you to track any aspects that interest you. Once complete, download your custom-built version in either Google Sheets or .csv format.
Mobile
- The YouTube Studio app is free and easy to download for both Android devices as well iPhones.
- Sign in to your account by opening the YouTube Studio app.
- The dashboard is a great way to get an overview of your data. You’ll be able to see how many subscribers you have, whether viewers are watching your videos on your channel, and even what hour they were viewing it! If you want more detailed information about this section then select “View More.”
General Reports of YouTube Video Analytics
YouTube analytics tools are deleted insightful.
The platform is comprehensive, with features that go beyond simple metrics. It can track a mix of information about the channel’s performance as well as target audience and content growth, which may be overwhelming for beginners looking to get started.
The YouTube Analytics tool is a great way to get an idea of what’s going on with your YouTube channel. In this section, we’ll look at some main general reports and their meanings in more detail.
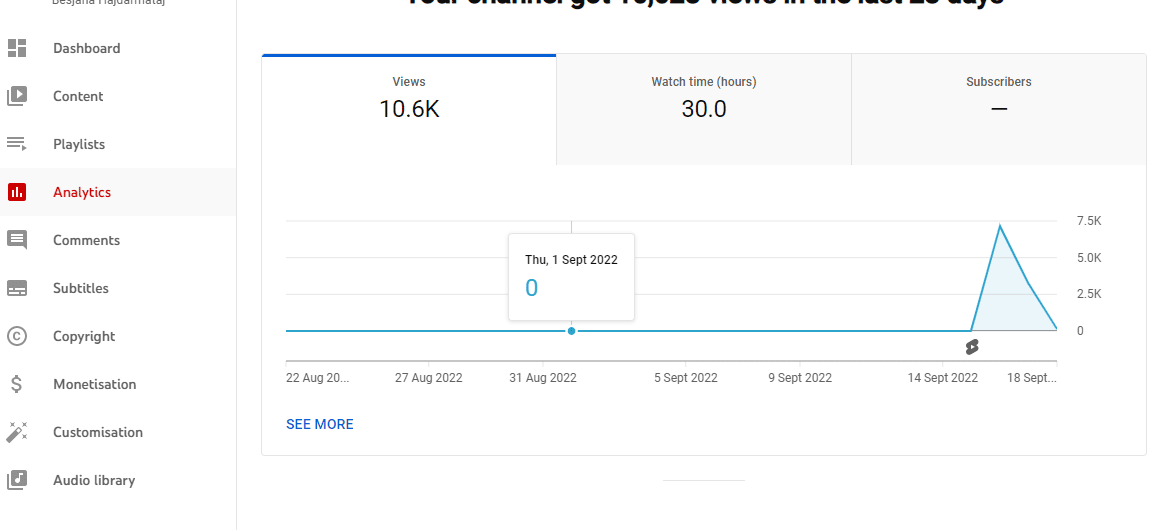
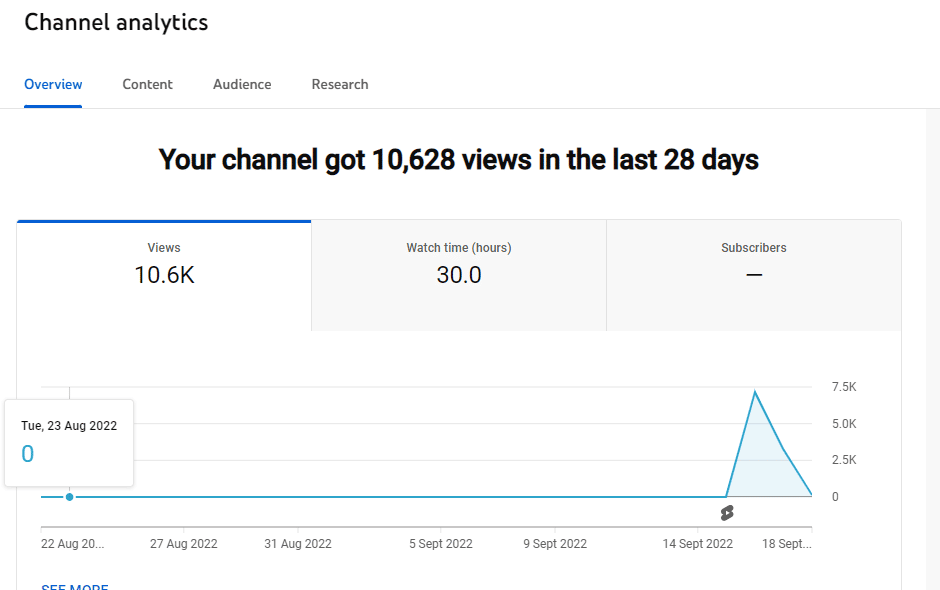
Channel Analytics Overview Report
The first thing appearing is the channel overview report on the dashboard of your YouTube channel analytics. It gives an overall idea of how successful and productive the last month was for your channel.
You can view the following YouTube metrics from your overview tab:
-Subscribers: You can see how many new subscribers you’ve received in the last 28 days. Activate the Subscriber bell notifications and get informed immediately.
-Views: Here you can see the number of total views your channel has gained.
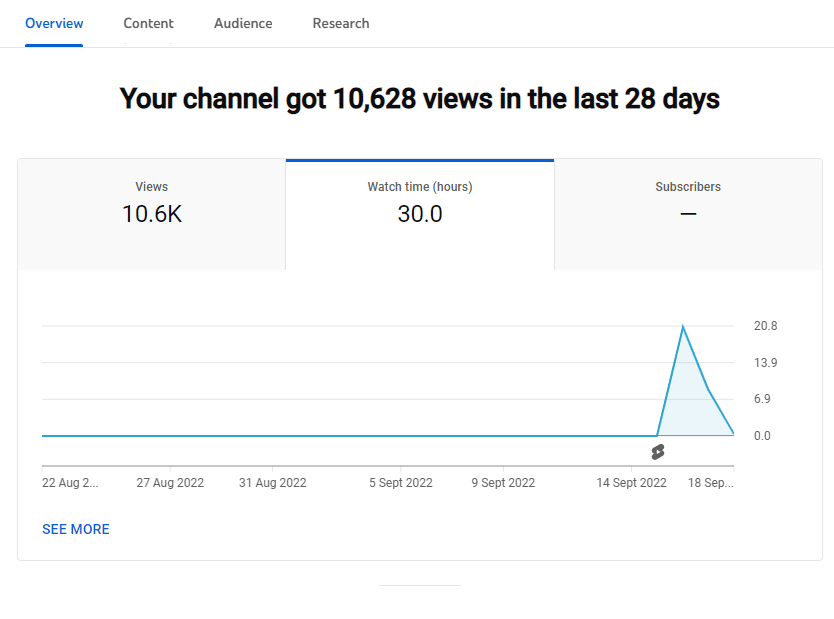
-Watch time report: Here you can learn the number of hours your videos have been watched.
You can see your YouTube metrics compared with previous periods at a single glance, so you never have any doubts about whether things are improving or not. For instance, you may have noticed that your subscriber growth has been higher than normal. This could be because you published a very successful video the previous week, or perhaps, some tweaks you made to your YouTube marketing strategy are responsible for this change.
Realtime Report
Here, you can see how many times your latest video has been watched in real-time. This report can help you identify the videos experiencing spikes in engagement, so you will know what to focus on next.
You can see the viewers minute-by-minute on this Realtime Report. You’ll also be able to monitor what they are watching every hour by looking at both graphs, based on their local time zones.
Detailed Look At The Watch Time And Audience Reports From YouTube Analytics Tools
Both Watch time and Audience reports are decisive for YouTube promotion. You can’t ignore the power of analytics when it comes to YouTube. Even if you don’t have a lot of videos on your channel, watch time and retention rates are still important because they’ll help fine-tune future video strategies for optimal viewing experiences and high conversion potential.
Report From Watch Time
This report is a comprehensive look at how many people are retaining an interest in your videos. With this information, you can see which types of content draw more attention from viewers and make sure that future uploads will be as successful.
The following is a list of interesting watch time metrics:
Percentage of average view: The average percentage of a video on playback
Average view duration: The average length of a playback video measured in seconds.
Estimated time watched: The total amount of time users spent watching YouTube videos on this channel, video, or playlist.
Percentage of view: The number of viewers who were logged in at any given time during the video or playlist.
Watch time: This data shows the amount of time a viewer has been watching one video.
Views: The legitimate number of your views your video has received.
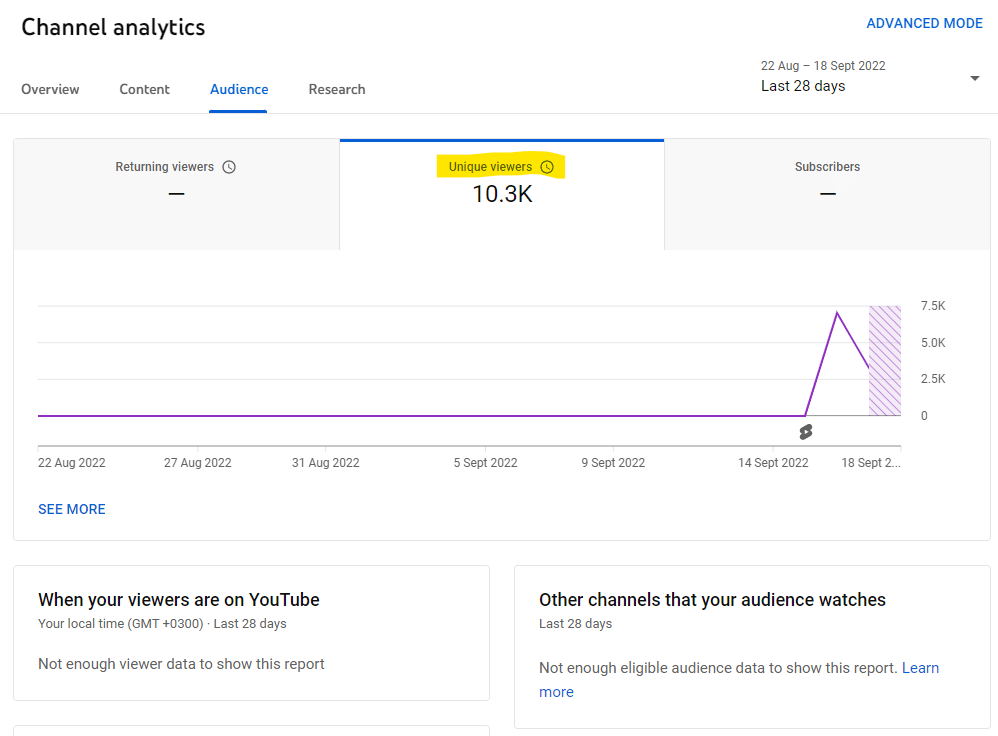
Unique viewers: The number of times the average viewer watches your video is calculated based on how many unique cookies they have. This means it will over-count users if you are viewing content from different devices or browsers.
Report From Audience Retention
With this insights-rich report, you’ll be able to better understand what’s going on with your viewers and if their experience is a memorable one.
Based on this data and the corresponding percentages, you may begin to check for mutual threads among your best-performing content. On one side of things, there seems like a connection between videos with lower retention rates.
The retention curve shows the parts of the video which are the most popular. YouTube recommends focusing on delivering strong content in the first seconds because it’s when viewers tend to drop off for good or at least until another piece catches their interest again. You may take a look at similar channels’ audience retention, too, if you want to get an idea about how your work compares against other videos of similar length.
The report provides some insightful information on retention rates by type of traffic. Organic visitors are more likely to return than those who come through ads, but there’s no difference between paid skippable videos and display advertising for this metric.
Skippable Video Ad: The views for autoplay ads that can only be skipped after five seconds.
Display Ads: The number of times the user played a video from an ad displayed on their screen, including those seen in search results or while browsing other websites.
Organic Traffic: Views that come from user intention. Organic traffic is measured by the number of people who watched videos with searches, clicks on suggested or recommended content, and browsing channels.
With retention metrics, you can get a clear picture of what’s working and not working for your videos. You’ll be able to take actionable insights into account when creating future YouTube content.
Reports From Playback Locations
The data in this report gives you a lot of insight into the reach and impact your videos are having. It’s great for collaborating with partners or colleagues because it shows where they’re playing on YouTube, either natively or embedded somewhere else.
This is an easy way to track the views on your videos. You can check how many people watched it when viewed from other websites or YouTube directly, and if they were viewing this specific page of one particular video then that will also be shown in analytics with its statistics too.
The playback reporting service will show where users are viewing the content from as well as traffic sources or if it has been shared with those social media platforms from within YouTube itself. Metrics from this report contain:
Page of the YouTube Channel: This view comes on the channel’s page directly.
Watch Page of YouTube: This is coming from the special URL of the video and means the video has been watched on YouTube from the video’s exact page.
YouTube Other: YouTube has a way of knowing where on the platform you watched a video, but for some reason, some of them have not been detected. It’s almost as if people are watching on the YouTube watch page.
Apps and External Websites: Here you can find the features which viewers used to reach out to your videos.
Reports Coming From Traffic Sources
The Traffic Sources Report is another key metric to monitor for trends. Here are the sites and YouTube characteristics that viewers used in their search of your content, which may provide some insight into how they found you.
You can use this information for a better video promotion strategy and see if they are paying off by looking at how people search, click on suggested videos thumbnails, or follow links from social media.
Reports From Devices
The devices report will help you identify the different types of technology users have to watch your videos. This includes not just computers, but also mobile phones and tablets as well game consoles or TVs with web browsers installed on them!
With this information, you can better target your advertising and outreach campaigns. Likewise, the type of content that is shared will also change as a result — if most views come from mobile devices then shorter tutorials might be more appropriate rather than those 20-minute-long videos used before.
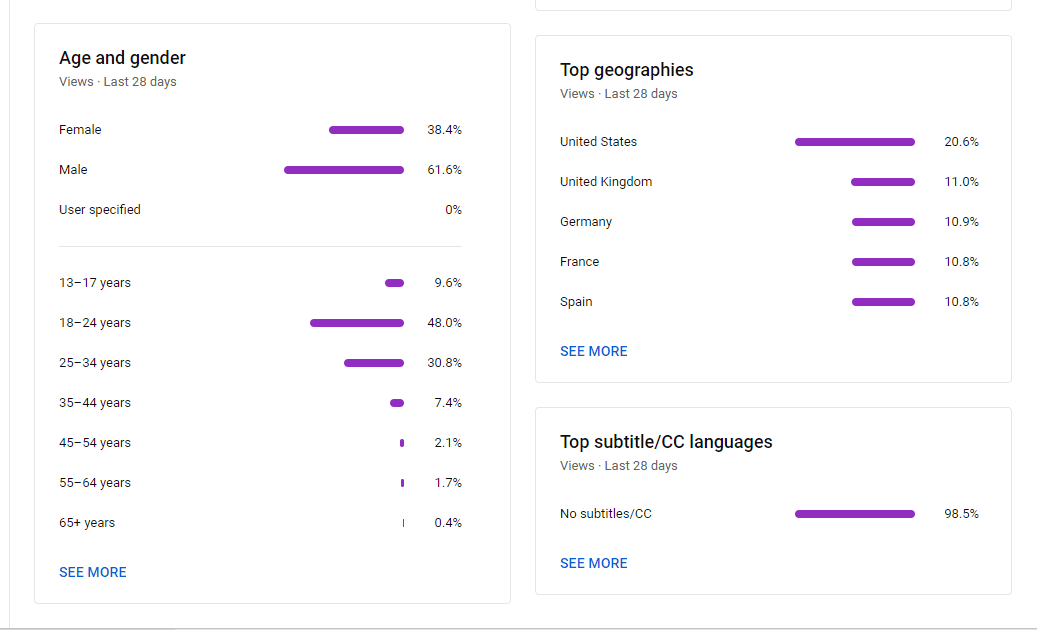
Report From Audience Demographics
The statistics for people who watch your videos on YouTube can give you a good idea about their age, gender, and location. You will also know what language they speak by looking at these data points. This data is based on other channels your audience watches.
Engagement Reports From YouTube Analytics
Video engagement reports show how viewers are engaging with your video content. YouTube analytics tools include metrics such as:
- Subscribers
- Likes & Dislikes
- Sharing
- Comments
Report From Likes and Dislikes
The number of likes and dislikes is tracked in this report. It’s important because it tells you what people think about your videos, which can help with improving future content or deciding whether to post one or not.
Don’t get discouraged if you’re not getting high numbers of likes on your videos. Viewers are probably commenting or sharing more than they like your posts.
However, if you start getting a flood of hate from trolls and potential competitors then that might be an issue. You should check your videos for dislikes because sometimes people will post negative comments just out of spite, and that is a concern for your channel.
Report from Subscriptions
The YouTube report is a comprehensive look at your account’s subscriber count, broken down by date and location. This will let you see which posts are getting the most engagement so that you can focus on those for future new videos.
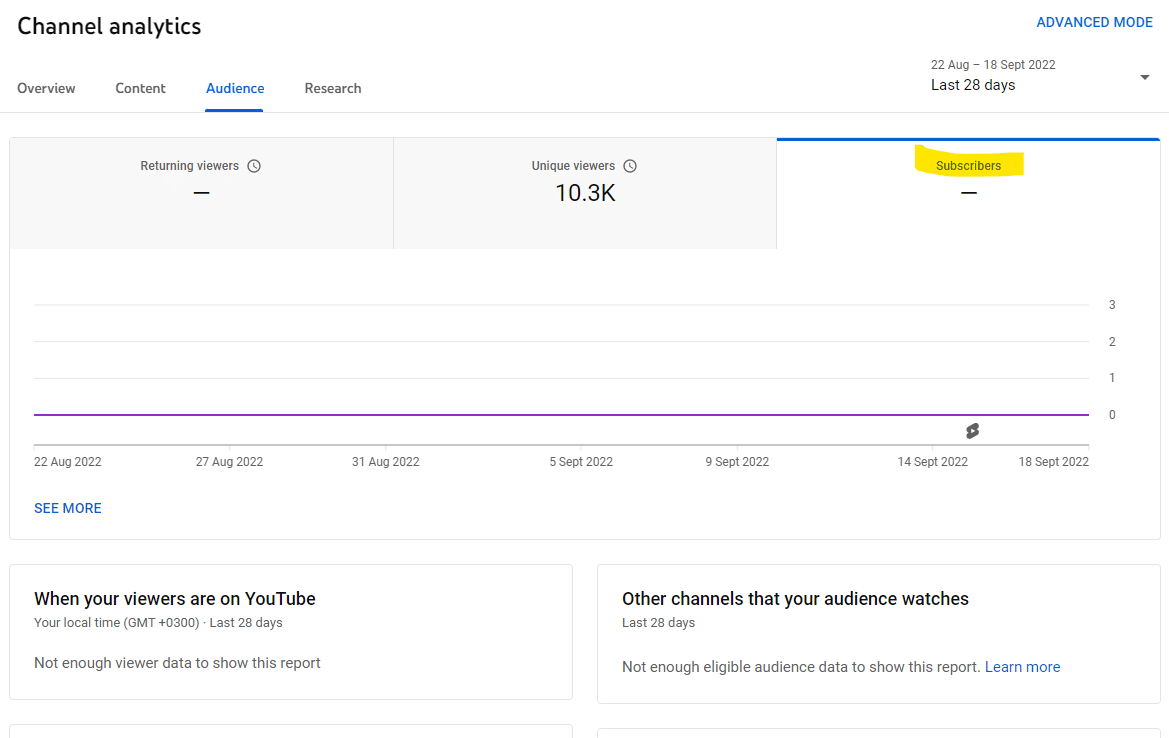
This report will show you which content is winning subscribers and their origin. The more subscribers you have the better since you can see them as a potential to increase your engagement on the YouTube homepage. You may also check how many people left your channel, so that’s something to think about.
Report from Sharing
This report will show you how often your videos have been shared on other platforms such as Facebook or Twitter.
If you want your content to be seen, then sharing it on social media is one of the best ways. This report will show how YouTube can help promote and increase engagement with posts that are targeted toward different audiences.
Report From Comments
From this report, you can learn the number of people commenting on your videos.
The YouTube comment segment is a great place for an engaged audience to have a conversation. You can also get an unfiltered look at their thoughts on the content you share by reading them here.
People love to post encouraging comments on your videos, so be sure you reply. It’s important for tutorial videos and customer support.
Report From Cards
When you include interactive content in your videos, these reports help you understand how viewers interact with that element.
The key to getting the most out of your card strategy is knowing which one will work best for each situation: placement, timing, and duration. When you’re in the market for a new strategy, look at what works best. Then modify your approach to maximize clicks.
Report From Videos in Playlists
Did you know that every time your videos are added to a playlist or removed from one, it’s recorded in this report? Here you can reach default playlists like “Watch Later” and favorite ones too.
Having a playlist that’s just for tutorials makes sense because people are always looking to learn new things. You should consider making more of these types if they’re popular with others who queue them up often, too!
Great metrics included in this report:
- Playlist average time:The total number of minutes a user spends watching videos in your playlist after you’ve started it. This includes only web views.
- Playlists start: Here you can get the total number of viewers who played a playlist on their web browser.
- Playlist’s videos:Here you can find the total number of times videos that have been added to the YouTube playlist which includes as well the ones from the video owner’s playlists.
- Playlist’s removed videos:Here you can find the total number of times videos have been removed from every YouTube playlist.
- Playlist start’s views:The average number of times a playlist was started. This includes only web views that happen as part of the video-sharing service.
The Earnings Reports You Can Access From YouTube Analytics Tool
The best way for your business to succeed in today’s competitive market is by posting relevant content on social media. So, focus on earnings!
When you have a correlated AdSense account, there are couple more reports available to view.
Report From The Estimated Earnings
The data collected from this report gives you details about your earnings from your transaction revenue, YouTube partner program, paid content, and YouTube ads. Some notable metrics within these categories include:
- Earnings:The monthly estimated revenue from the ads sold on Google as well as non-advertising ones for the selected region and date range.
- Ad earnings:The estimated amount of earnings from the ads sold on Google while you have selected region and date range.
- Revenue from Red partner:The estimated amount of money YouTube Red subscribers are earning. This includes both music-related as well as others that are not related to music content.
The YouTube Analytics data is estimated to be accurate but there may still be some errors in the final payment due process.
Report From Ad Rates
This report will show you how ad types bring out the differences compared to one another ad. In the metrics below, a few notable points include:
- Ad type:The type of format your ads have and their buying platform.
- Verified ad impressions served: The number that has been seen by users on either side verified playback count per 1k plays or views to calculate net revenue of impressions click-through rate (CPM).
- Monetized playbacks: How many people watched your video and saw ad post impressions? We’ll count that as a monetized playback, so long as they quit before the pre-roll begins.
- Playback-based CPM:This is the estimated amount of money earned per thousand playbacks.
Can We Get YouTube Analytics From Competitor YouTube Channels
Third-party platforms give you access to YouTube’s video analytics data for your competitors. The information is comprehensive and can be used for insights into the performance of other channels, so it’s worth looking into.
The video stats will show you how your content compares to other videos. You can also see what has been working for them in terms of viewing rates and subscriber growth, which could give you ideas about future video projects.
Upgrade Your Strategy With YouTube Analytics Tools
The YouTube Analytics Dashboard is powerful but it doesn’t show you the full picture of your social media marketing efforts. You can use more upgraded tools to measure and analyze this information, which will help improve future videos.
Analytics From Google
Google Analytics is a great way to see what people are doing when they visit your website. You can track their behavior and find out whether or not you’re getting the engagement that’s needed for conversion.
Use YouTube Analytics To Help You Upgrade Your Channel
The metrics you need to know about when creating a YouTube strategy are right here. Find out how many hours of your videos the audience watched, what their favorite content types are, or even where they live; all from one simple dashboard.
We make it easy for you to take your YouTube strategy one step further by seamlessly combining social campaigns with this powerful video management platform. No more juggling multiple platforms or trying jury-rigged solutions that don’t scale — we’ve got everything right here in our article.